Authors: Stephanie Tafoya and Luis A. Argueso

Some market participants think that selecting an appropriate compensation value that is consistent with fair market value (“FMV”) is as simple as selecting a median benchmark reported by a compensation survey. Unfortunately, as proven through numerous whistleblower complaints resulting in newsworthy settlements,[1] median benchmarks are not an automatic safe harbor for compensation that is both commercially reasonable and within FMV.
One should consider the following aspects of the survey data when selecting benchmarks:
Part One: What lies beneath compensation benchmarks based on production
Part Two: The ebb and flow of compensation benchmarks
Part Three: A Tidal Wave of Common Misconceptions
PART ONE: WHAT LIES BENEATH COMPENSATION BENCHMARKS BASED ON PRODUCTION.
Specialty Considerations
Prior to determining a compensation model, consider the specialty of the physician in question, including the scope of the physician’s work. For many specialties, compensation plans may include a number of components including: (i) base compensation (i.e., a fixed amount that is earned regardless of production); (ii) a production incentive (e.g., a productivity bonus paid in the form of a rate per work relative value unit (“wRVU”) above a predetermined wRVU threshold); (iii) a quality bonus tied to metrics/initiatives that may be fixed or set as a percentage of compensation; and/or (iv) compensation paid for additional services such as administrative services, call services, and/or advanced practice provider (“APP”) supervision services.
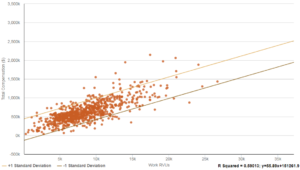
Due to the nature of the various provider specialties, certain compensation components may or may not be applicable, despite the fact that the surveys may report benchmarks for all provider specialties. Some specialties are unable to control the volume of patient encounters (e.g., hospitalist physician specialties). Typically, these hospitalist specialties are compensated in the form of shift payments. Therefore, the reported compensation per wRVU benchmarks for these types of specialties may be erroneous. For example, see Figures 1 and 2 within this article, along with the calculated R-Squared values.[2]
The reported compensation per unit benchmarks are often calculated by the benchmark surveys and are not a compensation amount reported by a medical group (i.e., the reported value does not represent what survey participants compensate their physicians per wRVU, but rather represents each respondent’s cash compensation amount divided by their wRVU amount). If the production volume is low, the resulting compensation per wRVU value will be high. It is important to take this into account when negotiating compensation with a highly productive physician that is providing services in a specialty that is typically compensated on a shift basis.
Figure 1:
Pediatric Hospitalist Compensation and Work RVUs
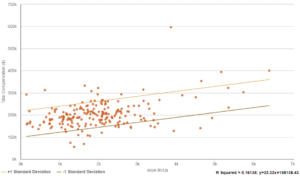
Figure 2:
Orthopedic Surgery Compensation and Work RVUs
Benchmark Considerations
A hypothetical example is illustrative: Dr. Smith is a pediatric hospitalist who performs at the 90th percentile production benchmark for wRVUs, and Dr. Smith feels the appropriate compensation rate is the reported median compensation per wRVU. Dr. Smith’s request may seem reasonable, but due to the nature of the specialty, such a plan would likely result in above-market compensation. This is clearly illustrated in Figure 3.
Figure 3:
Comparison of Compensation Plan to Benchmark – Pediatric Hospitalists
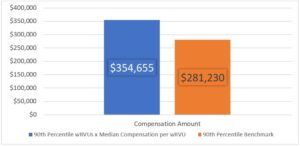
The 90th percentile wRVU production benchmark reported by MGMA 2017[3] for pediatric hospitalists is 3,260 wRVUs. The median compensation per wRVU benchmark reported by MGMA is $108.79 per wRVU. The product of these two values yields an implied compensation amount of $354,655 (rounded to the nearest dollar). Conversely, the 90th percentile compensation benchmark for pediatric hospitalists reported by MGMA is $281,230. Dr. Smith’s proposed plan would result in compensation over 26% above the 90th percentile compensation benchmark.
Another hypothetical scenario: Dr. Smith’s specialty and scope of services are driven by productivity. Are there additional concerns with using median compensation per wRVU benchmarks?
As mentioned in a previous paragraph, benchmark surveys will calculate compensation per unit benchmarks by taking the reported cash compensation amount and dividing it by the wRVU amount for each respondent. Based on this observation, it is of significance to understand what the survey benchmarks include in both cash compensation and wRVU data. Within many benchmark surveys, total cash compensation data reported includes not only base compensation for professional services, but may also include compensation received for quality incentives, call coverage, advanced practice provider (“APP”) supervision, etc. Therefore, the reported compensation per wRVU value is likely not the actual compensation per wRVU that is being received by the respondents. Additionally, what is included in cash compensation data creates concern regarding “stacking” of compensation. When compensating a physician for a suite of services, it is important to consider the aggregate compensation to a physician to ensure the total payment does not far exceed fair market value. Moreover, when using wRVU benchmarks, it is important to determine whether the data being reported is specific to the services personally performed by the physicians, or whether the data includes services rendered by APPs working under the physicians.
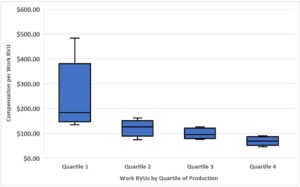
Possibly the biggest misconception when providing compensating on a per unit of production basis, is that as production increases so does the compensation received per unit of production. In actuality, the compensation per production unit typically decreases as production increases. See the example illustrated in Figure 4. Therefore, if Dr. Smith steadily performs at the 90th percentile production benchmark, increasing Dr. Smith’s compensation per wRVU to the same level will likely result in compensation that significantly exceeds FMV. Using data from MGMA 2017, multiplying the 90th percentile wRVU production benchmark of 3,260 by the 90th percentile compensation per wRVU of $218.06 for pediatric hospitalists, results in an annual compensation amount of $710,871. This compensation amount is over 2.5 times the 90th percentile compensation benchmark! This inverse relationship occurs for many reasons (e.g., a newly hired physician may have a high base salary plus additional fixed compensation such as a signing bonus, but has low production due to still establishing a patient panel).
Figure 4:
Pediatric Hospitalist Compensation Per wRVU by wRVU Production Quartiles
FMV PITFALL: It is imperative to understand all components of the benchmark data being utilized, especially the market trends regarding how the various physician specialties are compensated. HealthCare Appraisers, Inc. is available to help navigate the dangerous waters surrounding the fair market value of physician compensation arrangements.
[1] Carr, J. Milliron, M. and Hutzler, C; Is Median Compensation in the Crosshairs? Hospitals & Health Systems Rx American Health Lawyers Association (May 16, 2016)
[2] R-Squared represents the fit of the regression line between two variables. An R-Squared value of 1 indicates a regression line of perfect fit.
[3] Source: MGMA DataDive Provider Compensation 2017. Used with permission from MGMA, 104 Inverness Terrace East, Englewood, Colorado 80112. 877.275.6462. www.mgma.com. Copyright 2017. Please visit the MGMA “Data Insights” page, available at: https://www.mgma.com/data, to learn more about MGMA DataDive®.